


Follow Us


April 18, 2024
The Huntsville/Madison County Chamber’s Accounts Receivables Department has seen an increase in the number of notices recently about invoices and check payments being lost in the U.S. mail. In addition, we have also seen more emailed invoices not being received. Here are some tips and options to ensure that you receive our invoice and that we receive your payment.
April 18, 2024
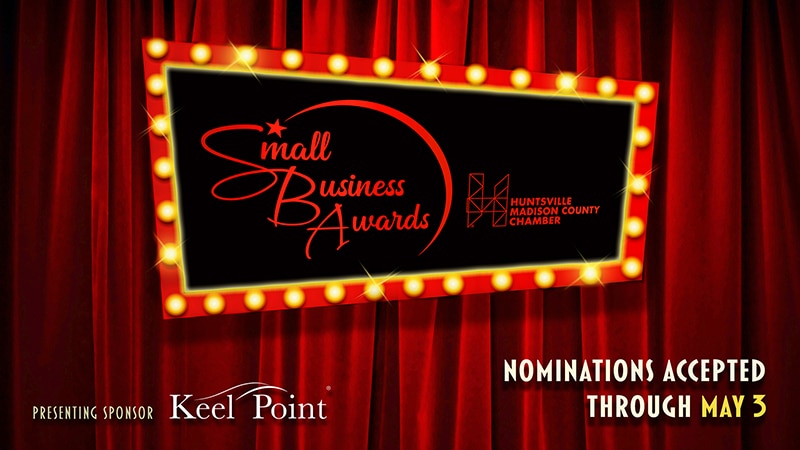
Here's the list of the nominees for the Small Business Awards as of April 12. Nominations will remain open until May 3.
April 18, 2024
The Chamber conducts an annual Wage & Benefit Survey for its membership each spring. This survey helps local employers gauge their compensation and benefit data against other companies in our region. The survey closes on Friday, April 26.
April 4, 2024
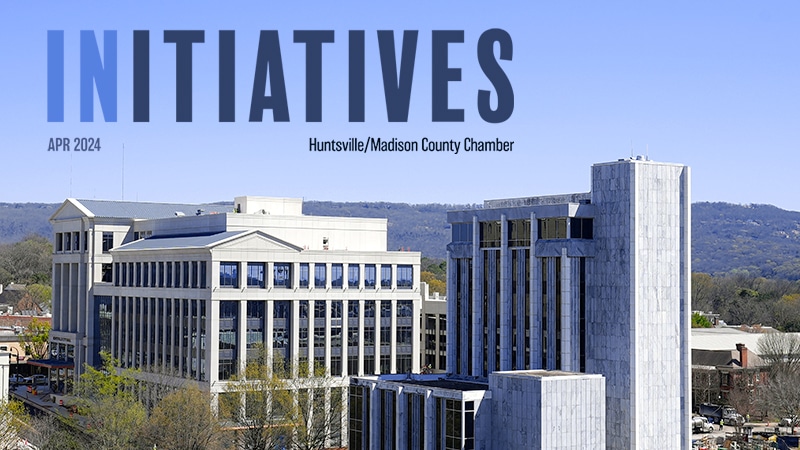
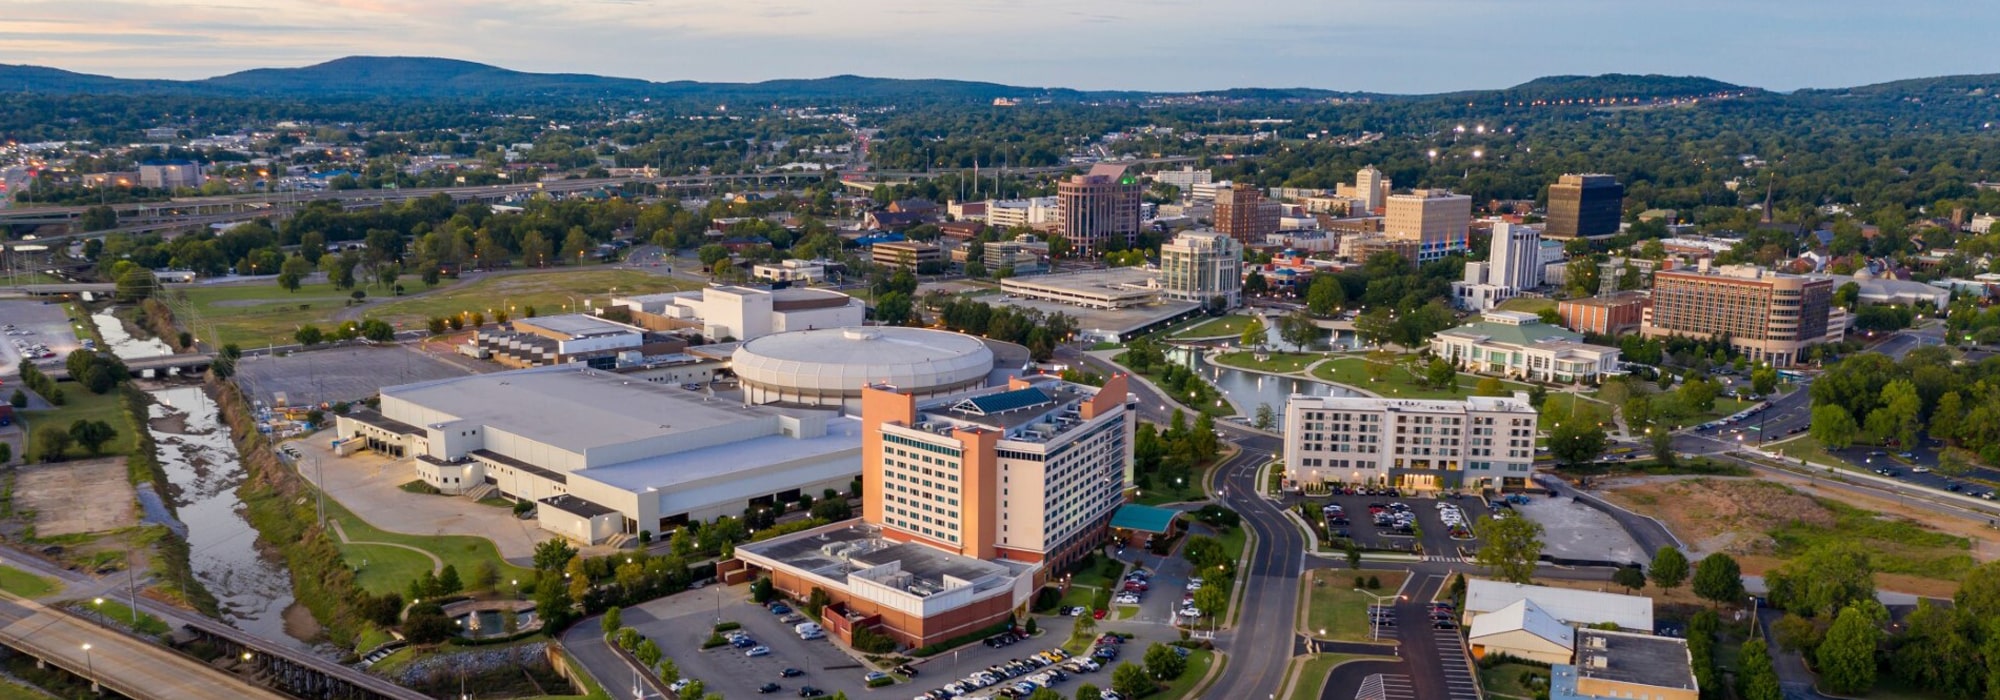
Read along as we spotlight recent developments in downtown Huntsville in our cover story. We also profile local small businesses and wrap up our recent Montgomery Trip.

UPCOMING EVENTS
RECENT EVENTS
All images taken by the Huntsville/Madison County Chamber are available for our members to use.